OpMAP analysis and visualization of large opinion spaces
Publication: Dynamic metaphoric maps

One of the challenges that we faced during the implementation of the OpMap was to produce a map where every country has the size that corresponds to the number of people that hold opinions of that country. Such visualizations constructed starting from geographic maps are well known under the term of cartograms. The OpMap posed two additional cha... Read more 23 May 2022 - less than 1 minute read
Impressions from OpMAP installation at Open Codes

The exhibition of OpMAP at ZKM, Center for Art and Media, came to an end. During the exhibition visitors could observe the space of the opinions on the veggie debate in form of a conceptual map - see the teaser. They could also fill in the questionary using the iPad stand next to the projection and observe their position appearing on the map. B... Read more 18 Oct 2018 - less than 1 minute read
OpMAP goes to Open Codes

OpMAP goes to Open Codes, an exhibition taking place at ZKM, Center for Art and Media, from 20.10.2017 till 5.8.2018. If you have a chance to visit Open Codes and interract with OpMAP, we will be happy to hear your feedback. Read more 18 Oct 2017 - less than 1 minute read
Welcome to OpMAP

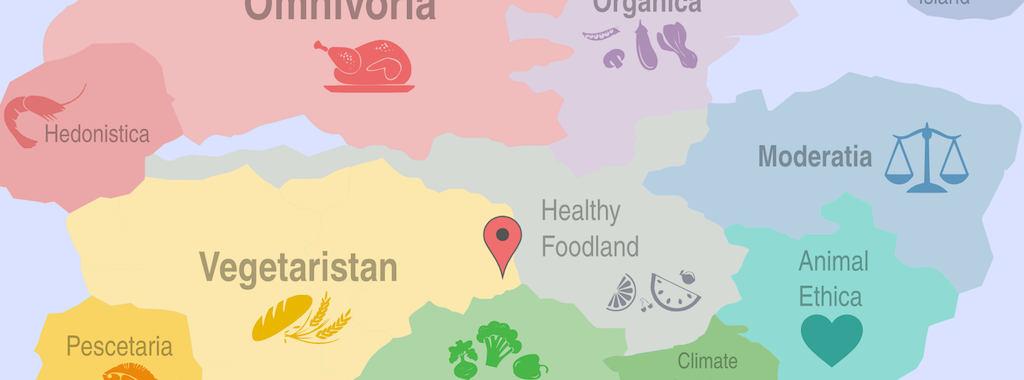
It may be hard to grasp the variety of opinions on a complex issue. OpMAP helps to make sense of large opinion samples by visualizing them in form of a map. Most people are familiar with geographic maps and even enjoy examining them. OpMAP makes use of the map metaphor to create a highly intuitive visualization that readily unveils the opinion d... Read more 29 Aug 2017 - 1 minute read